Go Runtime Basics and What Ships Inside Every Binary
Every Go binary carries a runtime with the scheduler, garbage collector and allocator. See how much space it takes and how to inspect a build.
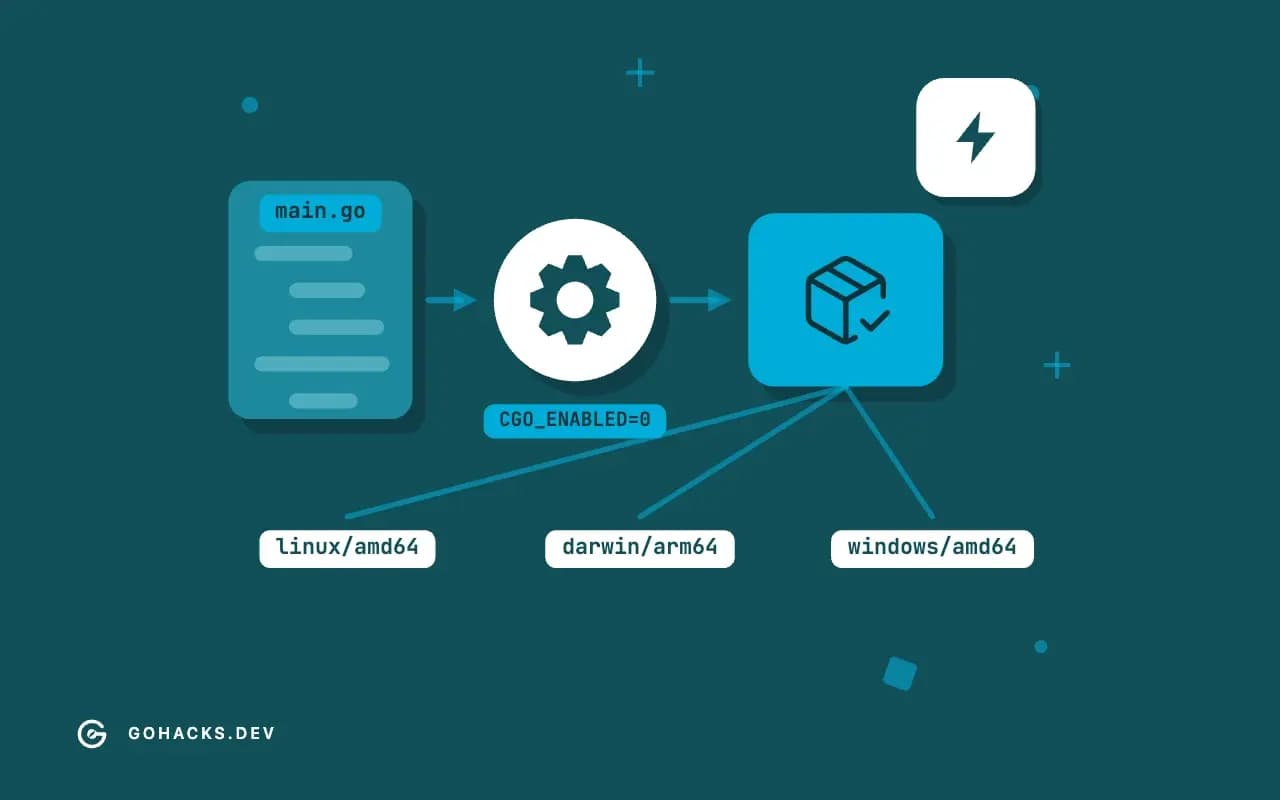
A Go program is a single file you can copy to a server and run, and that convenience has a cost people notice the first time they build hello world and see 2 MB. The size is not your code. It is the runtime, a library of services that the language assumes and that every Go binary carries inside it. Understanding what is in there answers a handful of recurring questions: why goroutines are cheap, why you cannot "just link without the garbage collector", why a static binary starts without a dependency and why the same program behaves slightly differently on different Go releases. This article opens a binary and looks, using the toolchain's own commands. It is part of the Go basics path, and the individual services have articles: the scheduler, the garbage collector, stack and heap and the memory model.
Tested with Go 1.25.6, macOS on Apple Silicon (arm64)
What the runtime is
There is no interpreter or virtual machine between a Go binary and the operating system. The compiler turns your code into machine code, and the linker adds the runtime package's compiled code and the standard library packages you import. The runtime provides, in rough order of how often you meet them:
| Service | What it does |
|---|---|
| Scheduler | Multiplexes goroutines onto operating system threads |
| Memory allocator | Serves new, make and escaping values from size-classed spans |
| Garbage collector | Finds and reclaims unreachable heap objects, concurrently |
| Stack management | Starts goroutine stacks small and grows them by copying |
Channels and select | Queues, blocking and wake-up for goroutines |
| Maps and strings | The hash table implementation and string operations |
Panics and defer | Unwinding, running deferred calls, recover |
| Type information | The metadata reflect, fmt and interfaces rely on |
| Stack traces | Symbol tables used to print goroutine 1 [running]: |
| Signal handling and timers | os/signal, time.Timer and sleeping goroutines |
Each of those is why a feature that looks like a keyword, go, chan, defer, make, costs a call into the runtime. The go statement calls into the scheduler to create a goroutine. A make(chan int) allocates a channel structure. An interface method call consults type metadata. This is also why the language is portable to a new architecture with a modest amount of assembly and a lot of Go: the runtime is mostly written in Go itself.
Looking inside a build
This program prints a few runtime facts and reads its own build information. Build it, then inspect the file:
package main

import (
	"fmt"
	"runtime"
	"runtime/debug"
)

func main() {
	fmt.Println(runtime.GOOS, runtime.GOARCH, runtime.Version(), runtime.NumCPU(), runtime.GOMAXPROCS(0), runtime.NumGoroutine())
	if bi, ok := debug.ReadBuildInfo(); ok {
		fmt.Println(bi.GoVersion, bi.Main.Path, len(bi.Settings) > 0)
	}
	var ms runtime.MemStats
	runtime.ReadMemStats(&ms)
	fmt.Println(ms.Sys > 0, ms.HeapAlloc > 0)
}go build -o app .
./app
ls -l app | awk '{print $5, "bytes"}'
go version -m app | head -6darwin arm64 go1.25.6 10 10 1
go1.25.6 example.test/lab true
true true
2474338 bytes
app: go1.25.6
path example.test/lab
mod example.test/lab (devel)
build -buildmode=exe
build -compiler=gc
build CGO_ENABLED=1The program reports the platform, the release, the number of CPUs and GOMAXPROCS, which defaults to the CPU count and is discussed in GOMAXPROCS inside a container, and one goroutine, the main one. It then reads the build information the linker embedded: the compiler version and the main module. go version -m prints the same data from outside: the Go release that built the file, the module path and the build settings, among them CGO_ENABLED, GOARCH and GOOS. For a binary with dependencies, it also lists every module and version, which makes it a quick audit of what you shipped, and govulncheck uses the same data to look for known vulnerabilities in a built binary.
How big is the runtime
The symbol table says where the bytes went. go tool nm -size lists every symbol with its size, and a little awk sums them by package prefix:
go tool nm -size app 2>/dev/null | awk '$3 ~ /^[TtDdRrBb]$/ {split($4, a, "."); size[a[1]] += $2} END {for (p in size) print size[p], p}' | sort -rn | head -81214114 runtime
152112 typerel
152112 _type:*
126680 go:func
39816 go:string
38680 time
36848 fmt
34722 strconvThe runtime package accounts for about 1.2 MB in a binary of about 2.4 MB, and time, fmt and strconv follow at 35 to 40 KB each. The sums double-count a few entries that alias the same address, such as the type tables, so read them as an estimate and not an audit. The single largest symbol is runtime.pclntab, about 530 KB, which maps program counters to function names and line numbers. That table is what makes a stack trace readable, and it is also the main reason that stripping symbols with -ldflags='-s -w' shrinks a binary by a third, as your first program measured, with the trade-off that profilers and debuggers get less to work with.
If binary size matters, because you ship to a small device or a minimal container, the order of attack is: build with -ldflags='-s -w', drop packages you do not need (importing net/http or reflect-heavy libraries adds hundreds of kilobytes), and consider TinyGo for microcontrollers, which uses a different runtime. Compressing with UPX works and costs start-up time. Do not worry about 2 MB on a server.
Why it is static
The linker puts everything into one file. Unless the program uses cgo, or a package that needs the system's DNS resolver or user lookup through the C library, the result has no dynamic dependencies. You can scp it to another Linux machine and run it, and a container image for it can be scratch. The CGO_ENABLED setting in the build info tells you which kind you have. With cgo, the binary links against libc and needs it at run time, which is the cause of the classic "works on Debian, fails on Alpine" difference.
The runtime also decides start-up behavior. Before main runs, it initializes the heap, starts the scheduler's threads and the garbage collector's workers, processes GODEBUG settings and runs package initialization in dependency order, as the init article describes. That start-up is fast, on the order of a millisecond for a small program, which suits command line tools and containers that scale from zero.
The package you can touch
The runtime is mostly private, and a small public surface is yours:
runtime.GOMAXPROCS(n)reads or sets how many OS threads run Go code at once.runtime.NumGoroutine()counts live goroutines, a cheap leak detector, as counting goroutines at run time shows.runtime.ReadMemStatsand the newerruntime/metricsexpose heap and GC numbers.runtime.GC()forces a collection, which tests use and production code almost never should.runtime/debugoffersSetGCPercent,SetMemoryLimit,ReadBuildInfoandStack.- The
GODEBUGenvironment variable turns on tracing and behavior switches, such asgctrace=1andschedtrace, and Go release notes list the settings that changed.
What the runtime does not do
It does not make your program portable to every library: cgo breaks the static story, and system calls are platform specific, which is what build tags manage. It does not hide the cost of its services. A goroutine still needs a stack, a channel still costs a lock, and a map still has to hash. And it changes between releases, so a behavior you observe, such as the first capacity of an appended slice, can differ on the next toolchain. The runtime package documentation is at pkg.go.dev/runtime, and the go version -m and go tool nm commands are described in the go command documentation.